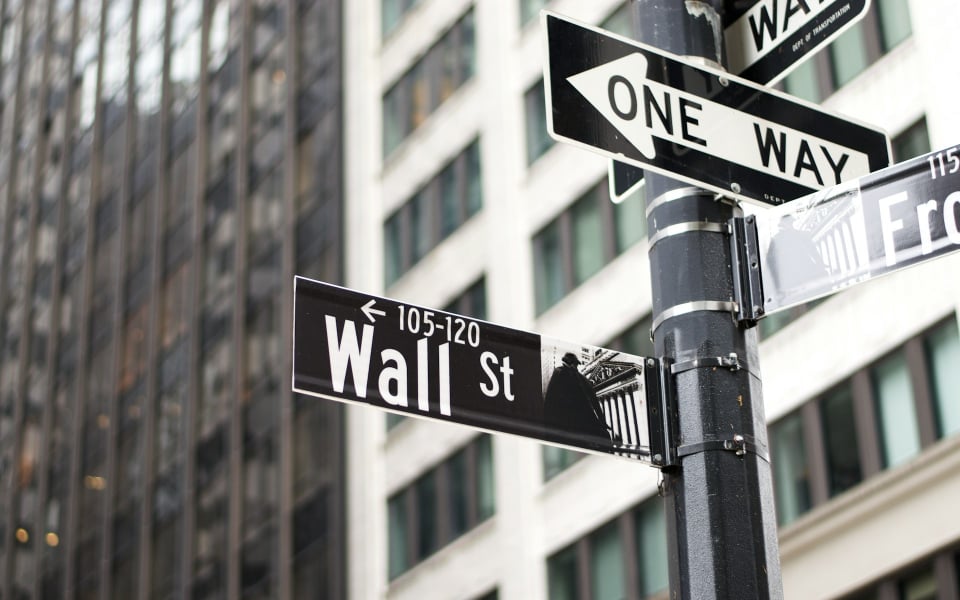
The upcoming US presidential election has many investors nervous and fearful. Justifiably so: the intersection of wealth and power is embodied in the relationship between the stock market and US elections. Both history and theory hold some intriguing conclusions about market and candidate performance.
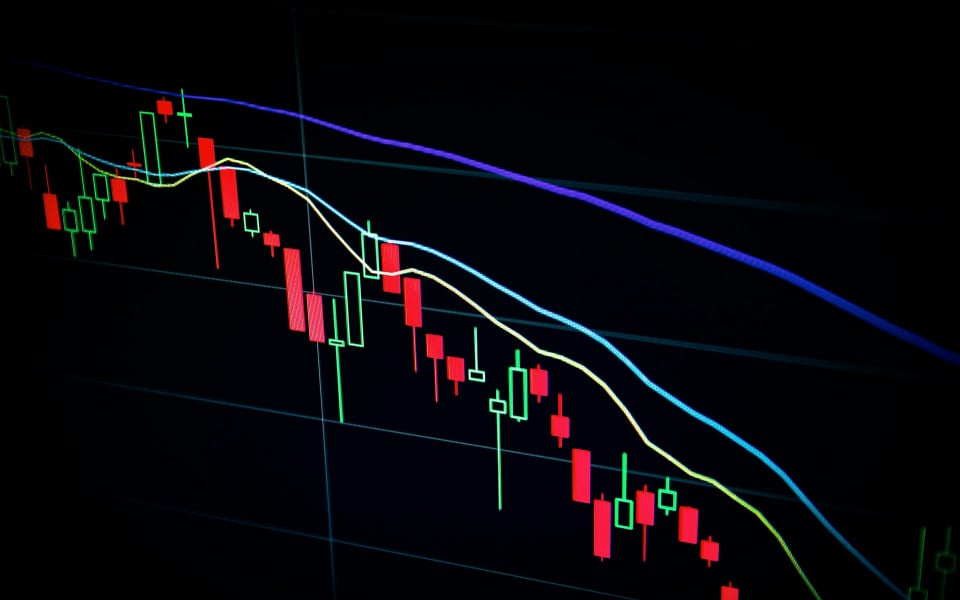
According to the CNBC article, "History shows stocks rally during presidential elections," presidential election years have historically been good to the stock market. The data cited is that between May and October, the S&P 500 (INDEXSP: .INX) rose in 19 of the past 22 election years dating back to 1920. The median gain was 4.1%. Though volatility also tends to increase, election year summers have been mostly positive. On the other hand, the two infamous counterpoints are 1932 and 2008. In 1932, the Great Depression coincided with a harrowing 55.7 % loss. In 2008, the global financial crisis coincided with a massive 31% loss. In addition, Merrill Lynch's

The other side of the relationship is the prediction aspect. Can the stock market predict the presidential election? CNN Money boldly answers in the affirmative: if the stock market goes positive from August to October, then Democrat Hillary Clinton will win, but if the stock market goes negative, then Republican Donald Trump will win. The article also cites the belief of S&P Global Market equities expert Sam Stovall and data dating back to 1944. When the stock market rose in that period, the incumbent party won the presidency 82% of the time. When stocks fell, voters replaced the incumbent party with the other 86% of the time. On August 1st, the S&P opened at 2,173.15; what will the close be on October 31? That August 1st price already seems pretty lofty, so as of today the S&P would need to rise by much in order for Democratic rule and continuity. If historically frequent autumn volatility occurs past October, then public office too will endure uncertainty and volatility as Donald Trump becomes an unprecedented nationalist president.

According to CNN Money, the outliers in the data include elections with a surprise geopolitical shock, like 1956, or with a strong third party presence, like 1968. Perhaps Libertarian Gray Johnson and Green Jill Stein will affect the outcome. Therefore investors and voters alike might consider not only looking to the political polls, but also the market tickers for answers on a frighteningly uncertain future.
The author does not hold any positions in any of the stocks above.